How do I securely connect Microsoft Fabric to SharePoint after the ACS retirement?
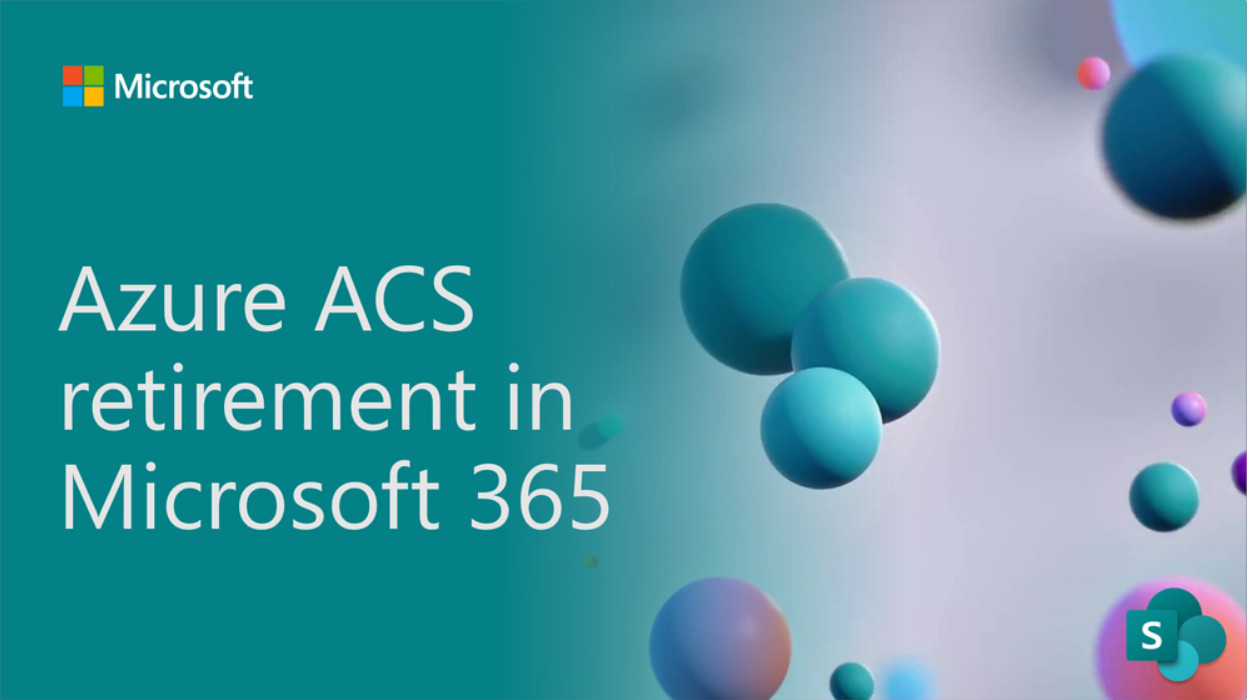
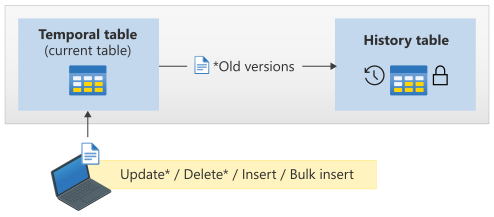
SharePoint ACS is retiring on April 2, 2026. Check the Microsoft announcement about this. If you or your organization has been using the old AppRegNew.aspx or AppInv.aspx pages to grant apps access to SharePoint, those permissions will stop working after that date. The modern replacement is an Entra ID app registration combined with the Sites.Selected … Read more